|
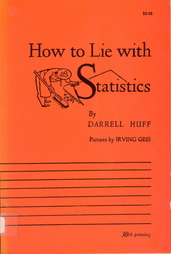
In 1954, Darrell Huff published a witty, informative exposé of the use of statistics by advertisers, the government and the media to mislead their audiences, called How to Lie With Statistics. Over the course of an entertaining 142 pages, Huff explained how the statistically challenged reader can see through the smoke and mirrors to get to the real meaning, if any, of what is being presented. I happened to stumble across a tattered copy of this book as an impressionable ten-year-old and remember enjoying it primarily for its cartoon illustrations. However, I like to think that it also started me down the path of being a keen observer of charts, graphs, and numbers, especially when they are being used to try to convince me of something.  The original cover! So it was with some amusement that I read an e-article that came over the transom. It's a reposting of a blog by fellow librarian Joyce Valenza which deconstructed an argument that Wikipedia was superseding libraries in the public's endless quest for information. Deconstructed? Nay! She sliced and diced the argument to shreds with the critical thinking skills of a true teacher-librarian born to the profession. The article's focus was an infographic that Open Site, the self-proclaimed "free Internet Encyclopedia" (wait, I though that was Wikipedia--- never mind) posted, which stated that Wikipedia had forced the print-version of Encyclopedia Britannica out of business. Here it is, for your amusement: I know what you are saying: "Whoa, those are a lot of statistics!" And I am replying: "Oh yes, a lot of unsupported and distorted statistics." And you are saying: "But look at all those sources!" And I am replying: "Oh yes, but remember, in the immortal words of Darrell Huff, that 'the secret language of statistics, so appealing in a fact-minded culture, is employed to sensationalize, inflate, confuse and oversimplify.'"  Cooking up the "big lie?" As Ms. Valenza notes, comparing library visits to Wikipedia visits, as the infographic purports to do, is a bit of an apples vs. oranges comparison, since one is achieved with the click of a mouse and one person can click repeatedly throughout the day (or night, if that person is an insomniac). Ms. Valenza goes on to ask some very pertinent questions about the research methods of the infographic creators, the types of questions that teacher-librarians need to instruct their students to ask, the types of questions that Darrell Huff was writing about in 1954: Which libraries are these people measuring? What students? And students are generally required to use multiple sources, so which do they consult after Wikipedia? How does YouTube factor into the equation? And where did they get the figure that books have declined by 12%? And after the Great Recession hit, library use increased! As Ms. Valenza notes, the authors of this infographic seem to need a lesson in improving their own research skills. And are we supposed to be impressed that there's an increase in students who are plagiarizing Wikipedia? Or more impressed that teachers are becoming more savvy in catching it? Eeeesh! But don't take my rehash as the final word. Check out the original blog post by Ms. Valenza at School Library Journal: the Never Ending Search. Kudos, Joyce! But I did learn that Wikipedia is looking for female editors...maybe I'll apply!
2 Comments
|
AuthorTo find out more about me, click on the Not Your Average Jo tab. Archives
February 2024
Categories
All
|

 RSS Feed